
Test your Android phone's performance with these free benchmarking tools
This not only gives you an idea of how fast your phone is, but also lets you see how it fares against marketplace rivals or older phones, and can help you troubleshoot problems by comparing against similar phones. Don’t worry, benchmarking your Android phone is easy and cheap. All these tools are free, fun to use, and a few are gorgeous enough to show off to friends.
Setup and Prep
Before you benchmark your phone or tablet, you’ll want to charge it up completely, then kill all background tasks in the multitasking menu. You don’t want anything to interfere with your tests, so you also might want to put it in Airplane mode to prevent it from fetching mail or receiving calls.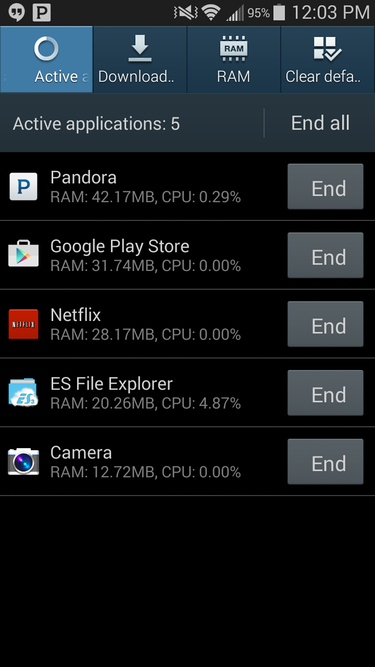
Interpreting Results
Don’t expect test results to tell you everything. Established designs sometimes outperform newer replacements thanks to better cooling or highly-tuned code. Bigger devices like tablets simply have more space to play with, allowing the use of faster, more power-hungry chips.Also in play are manufacturer and carrier Android add-ons that make a big difference in how fast a device can feel. The HTC One (M8) doesn’t have the fastest Snapdragon processor, yet its slickly tuned interface makes it feel top-shelf. Samsung’s TouchWiz has the opposite effect, introducing the occasional pause or hiccup that can make their hardware designs seem less cutting edge than they really are.
And of course, the fastest phone isn’t necessarily the best. You have to consider size, design, materials, camera quality, sound quality, and much more.
3DMark
3DMark reigns supreme for PC gamers and has made impressive headway on other platforms as the de facto standard for 3D benchmarking. The free Android version includes a flashy demo reel as well as the physics and GPU tests from the “Ice Storm” module of the Windows suite, while adding a few mobile-specific queries like battery life tests.


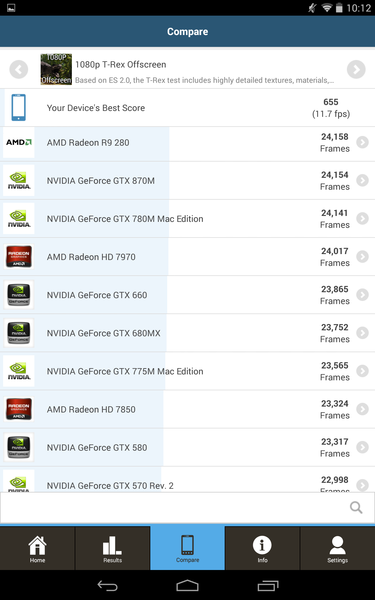
GFXBench 3.0
3DMark isn’t the only game in town when it comes to mobile GPU benchmarking. GFXBench arrived early in Android’s history and delivers more detailed results than Futuremark’s flagship. It’s also smaller; a big advantage if space is at a premium and your phone or tablet doesn’t support removable media.GFXBench is all about the details, and the developers serve them up page after page. You get more than framerates, and the numbers aren’t abstractions. Driver overhead figures, rendering quality tests, precision, and computing performance all get attention, taking GFXBench beyond gaming and deep into graphics geek territory. Like 3DMark, you also get access to a crossplatform database that extends to desktop systems, but GFXBench doesn’t leave Mac users out in the cold.
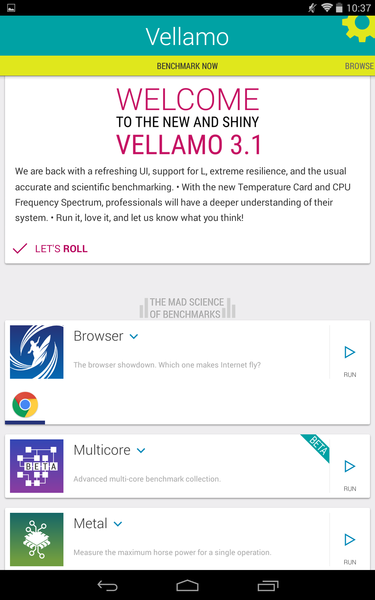
Vellamo
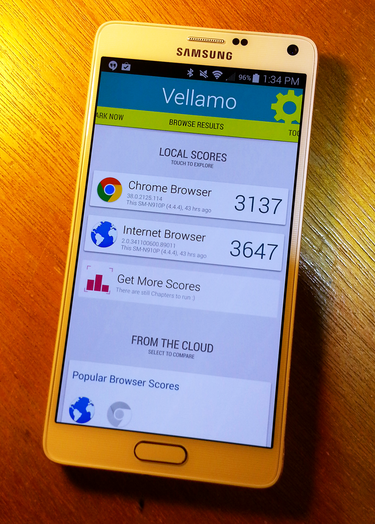
The hardware moguls at Qualcomm may have created Vellamo, but they don’t play favorites; the results show no favoritism towards Snapdragon processors. Vellamo doesn’t test everything. It’s mainly focused on testing browser speed, but also includes a mode called Metal that goes low-level for CPU, memory, and bandwidth testing, and a Multicore mode that tests the efficiency of thread latency and handling.Browser benchmarks may have fallen out of favor as stand-ins for proper mobile CPU tests, but they can still tell you quite a bit about the efficiency of the web browsing engine. On Android, changing up your browser can have a huge impact on performance.
Like most of the packages here, running the main suite takes a single button press, but some of these tests run a few minutes, so bring along some patience. Fortunately, Vellamo happens to be a pleasure to use, with elements of Material Design already incorporated into the user interface ahead of Lollipop’s release, so waiting isn’t a chore.
Geekbench 3
Unlike the others, Geekbench sneers at fashion and wears its sparse starting page like a hoodie at a shareholder’s meeting. No starship battles occur onscreen during the tests and no floating transparencies adorn the results window. All you get is a progress bar that slowly makes its way across the screen from zero to 100. When everything’s done, you get in-depth tables of results about the speed of your CPU and memory subsystems.After spending a lot of time with these apps, I can tell you from personal experience that sometimes just getting the numbers straight up is more appealing than it sounds. GeekBench serves them up quickly, too.


Basemark OS II and Basemark X
Basemark is one of the most comprehensive benchmarking suites available on Android with sibling apps that cover OS and gaming separately. The code is fresh, but the approach is old-school and will appeal to longtime PC benchmarking veterans.Basemark OS II is geared towards productivity and general use but unlike most of the other packages here, some useful features (including the battery test) are restricted to a pay version that you’ll need to contact the developer Rightware to obtain. CPU, storage, memory, web browsing, and camera tests are all included in the free version available on Google Play, however.
There’s plenty to like here otherwise, and Basemark X’s wide adoption means this one is worth putting alongside 3DMark or GFXBench, even if it means missing a few bells and whistles or shelling out for the full version.

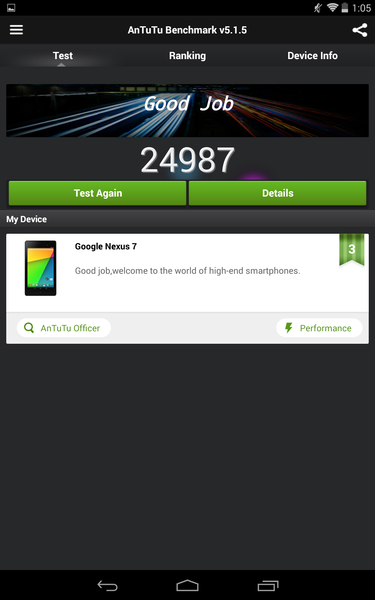
Antutu 5
Antutu, the venerable Android benchmarking standby, received a major update to version 5 in October (currently at 5.2) , addressing a few gaps in CPU and GPU testing that had opened up with age. Single-core CPU performance is now included, as core counts have begun to climb faster than developers can write the software that uses them, and diminishing returns are starting to kick in.The GPU benchmark gets a facelift also, upping complexity and adding in the Havok Vision Engine for real-world gaming results. Full support for Lollipop, ART, and the new 64-bit hardware from Qualcomm and Nvidia means Antutu 5 is ready for the very latest hardware.
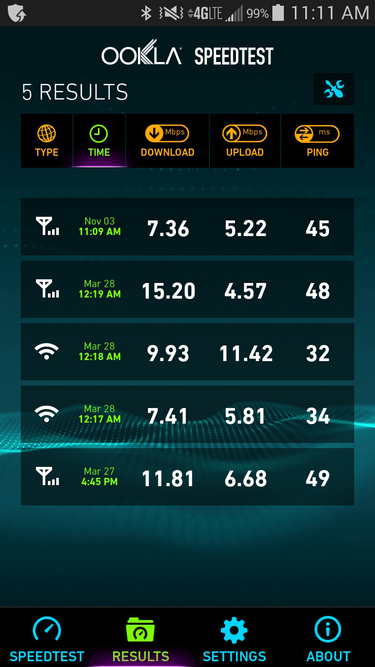
Ookla (aka Speedtest.net)
Mobile devices aren’t all about hot hardware; they are also highly dependent on carrier performance and phone location for their overall perceived speeds. Even snappy devices can feel dead in the water when you’re stuck with a flaky LTE signal. Ookla is an internet speed meter that runs bandwidth and latency tests to servers in any region you specify, from a nearby city to across the continent.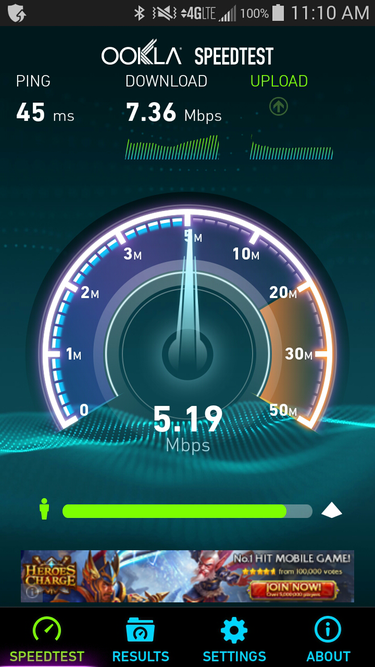
Bench like a Pro
Benchmarks tease out problems quicker than any other type of software, and they’ll turn you into a hardware expert in the blink of an eye. Don’t get too carried away, though. There’s a lot more than numbers to consider when it comes to performance.Speed freaks will run into the hard reality that high-end desktop and even laptop systems are orders of magnitude more powerful than anything in the mobile space today, despite claims of "desktop-class performance" coming from every manufacturer from Apple to Nvidia. On the other hand, try booting a modest desktop system with the miniscule 5 watts of power most mobiles thrive on.
Impressive performance comes in all kinds of packages, big and small. Just a few minutes with some free apps can help you determine if that hot new phone really is that much faster than the one you're using now.


No comments:
Post a Comment